2020 was not the year most people expected as the COVID-19 pandemic swept worldwide. However, it was a banner year for U.S. wind energy, despite the pandemic’s widespread disruptions. The U.S. market saw a record year in 2020 with developers commissioning 16.9 GW, representing an 85 percent increase over 2019. These new additions can provide enough energy to power more than 5 million homes.
A combination of factors contributed to such a strong year. The phase-out schedule of the Production Tax Credit (PTC) was a motivating factor, which offered 100 percent PTC value for wind projects that began construction or major investments in 2016 and had four years to complete construction and commissioning. But the record was also a manifestation of strong demand from American consumers for clean energy, including corporate America, which is increasingly turning to clean energy to power their businesses — and, of course, technology. Turbines are improving every year while manufacturers drive down costs.
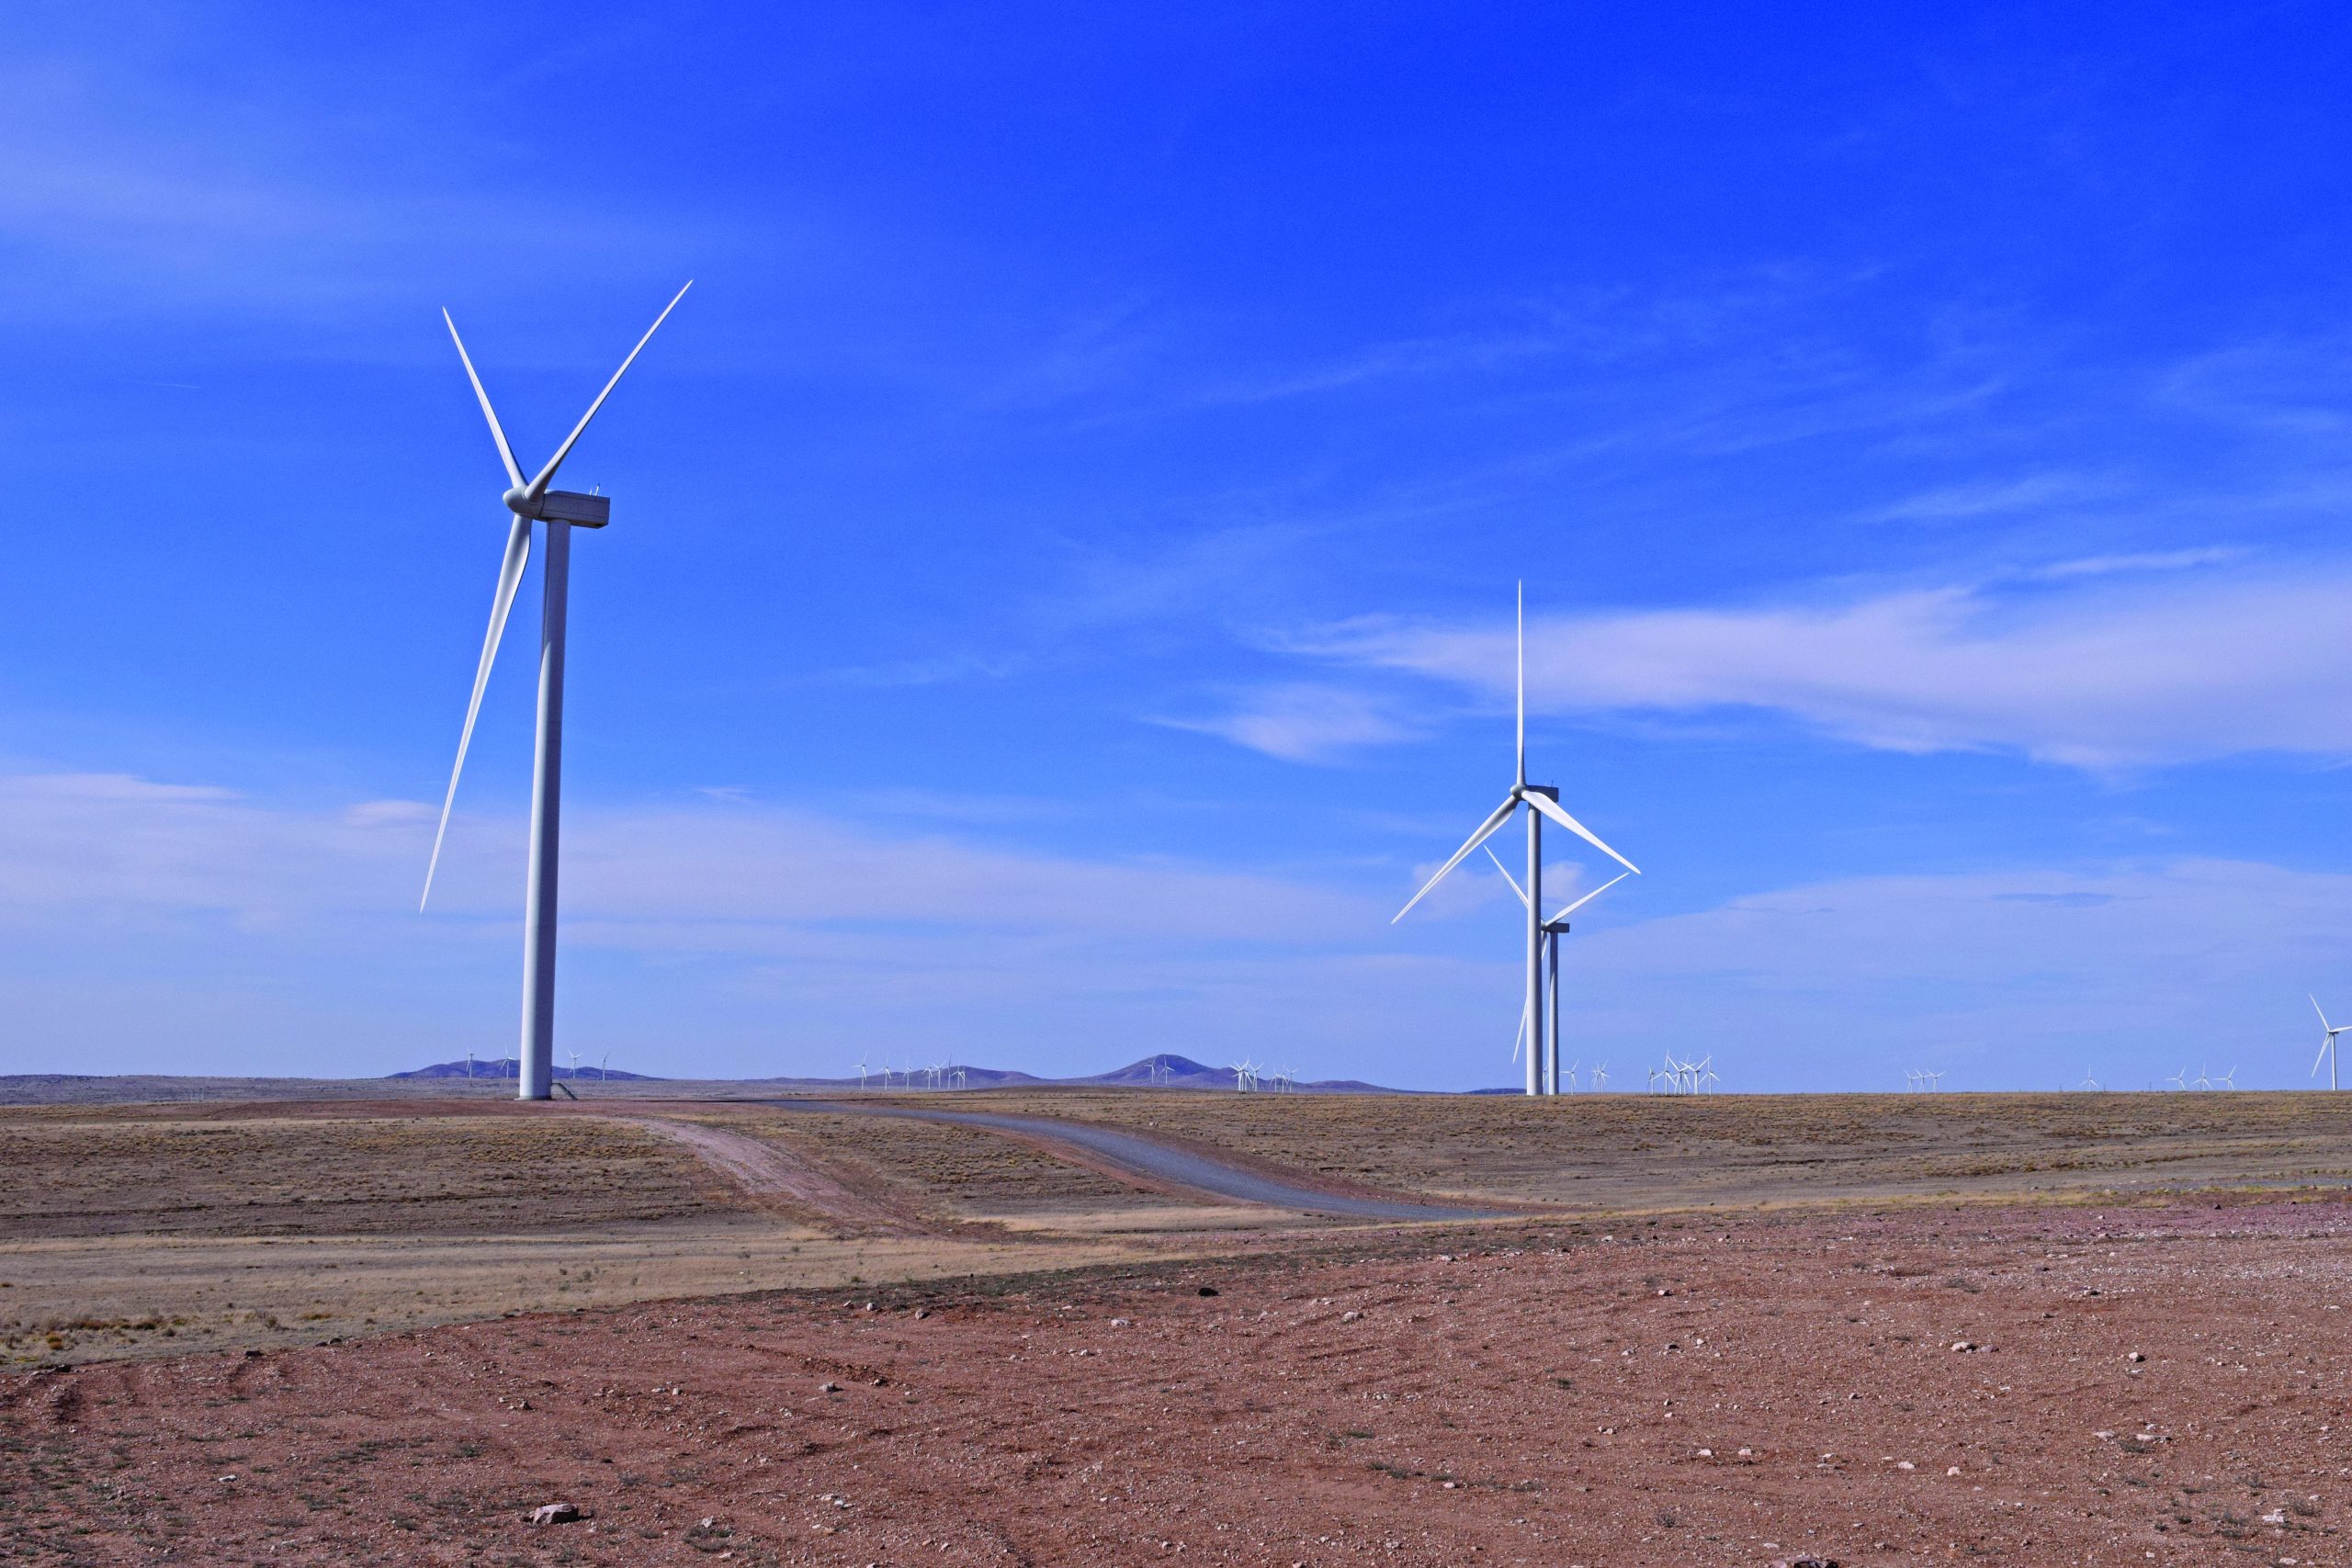
The wind industry is an American success story. Wind-power capacity has more than tripled in the U.S. since 2010 with an 11 percent compound annual growth rate over the last decade. As of the end of 2020, there was 122 GW of wind capacity in the U.S. with more than 65,000 wind turbines operating across 41 states and two U.S. territories. Many states source substantial proportions of their electricity from wind — especially states in the windy central corridor with consistently strong wind resources. Iowa, for example, leads the nation generating more than 54 percent of its electricity using wind, following by Kansas with 43 percent. A total of nine states generate at least 20 percent or more of their electricity using wind. Texas is just under 20 percent, but its total capacity of 33 GW dwarfs capacity in others. Iowa has the second largest capacity with 11.6 GW operating.
2021 Wind
Going forward, wind deployments in 2021 will still be strong, but they will cool off from their high point in 2020 since the PTC value for projects completed in 2021 drops to 80 percent PTC value. Despite this, the pipeline of projects under construction and in advanced development shows a robust market for the foreseeable future. Projects totaling 35 GW were under construction (17 GW) or in advanced development (17 GW) at the beginning of 2021. Not all of this has been in the works for years — nearly a fifth of these projects started construction in the fourth quarter of last year and another 500 MW entered advanced development. Texas continues to lead with 5 GW of wind in the development pipeline. Wyoming follows at 3.5 GW of wind generation capacity under construction, while seven other states have more than 1 GW of wind capacity in the pipeline as of early 2021.
The developers behind capacity added in 2020 are most of the well-known developers and project owners that have been active for years in the wind sector. The top 10 owners of 2020 represent 62 percent of the wind-power capacity brought online. NextEra leads the group after bringing 13 wind projects online totaling 2,898 MW. Xcel Energy delivered five projects in 2020 totaling 1,420 MW, including New Mexico’s largest wind farm to date. Berkshire Hathaway brought nine projects totaling 1,223 MW online in 2020.
Capacity Additions
A couple relatively newer companies to the U.S. market followed with significant capacity additions in 2020: Engie (previously GDF Suez) installed 1,108 MW, and Ørsted — better known as the world’s largest owner of offshore wind plants — brought online 676 MW of onshore capacity via its North American subsidiary. For most of these wind plants (54 percent), the traditional long term Power Purchase Agreement (PPA) was the power offtake mechanism of choice, followed by a higher than usual 29 percent proportion of direct utility ownership.
Despite the strong showing and robust pipeline, developers continue to report challenges. First, raising tax equity for projects in development is much more difficult due to economic uncertainty, tighter lending standards, and more limited capital allocations. Second, lingering pandemic impacts still disrupt supply chains, slow siting and permitting processes, and hinder construction and installation schedules. Resolutions of these issues are sure to unleash further wind-power growth.
Wind-Turbine Manufacturer Trends in 2020
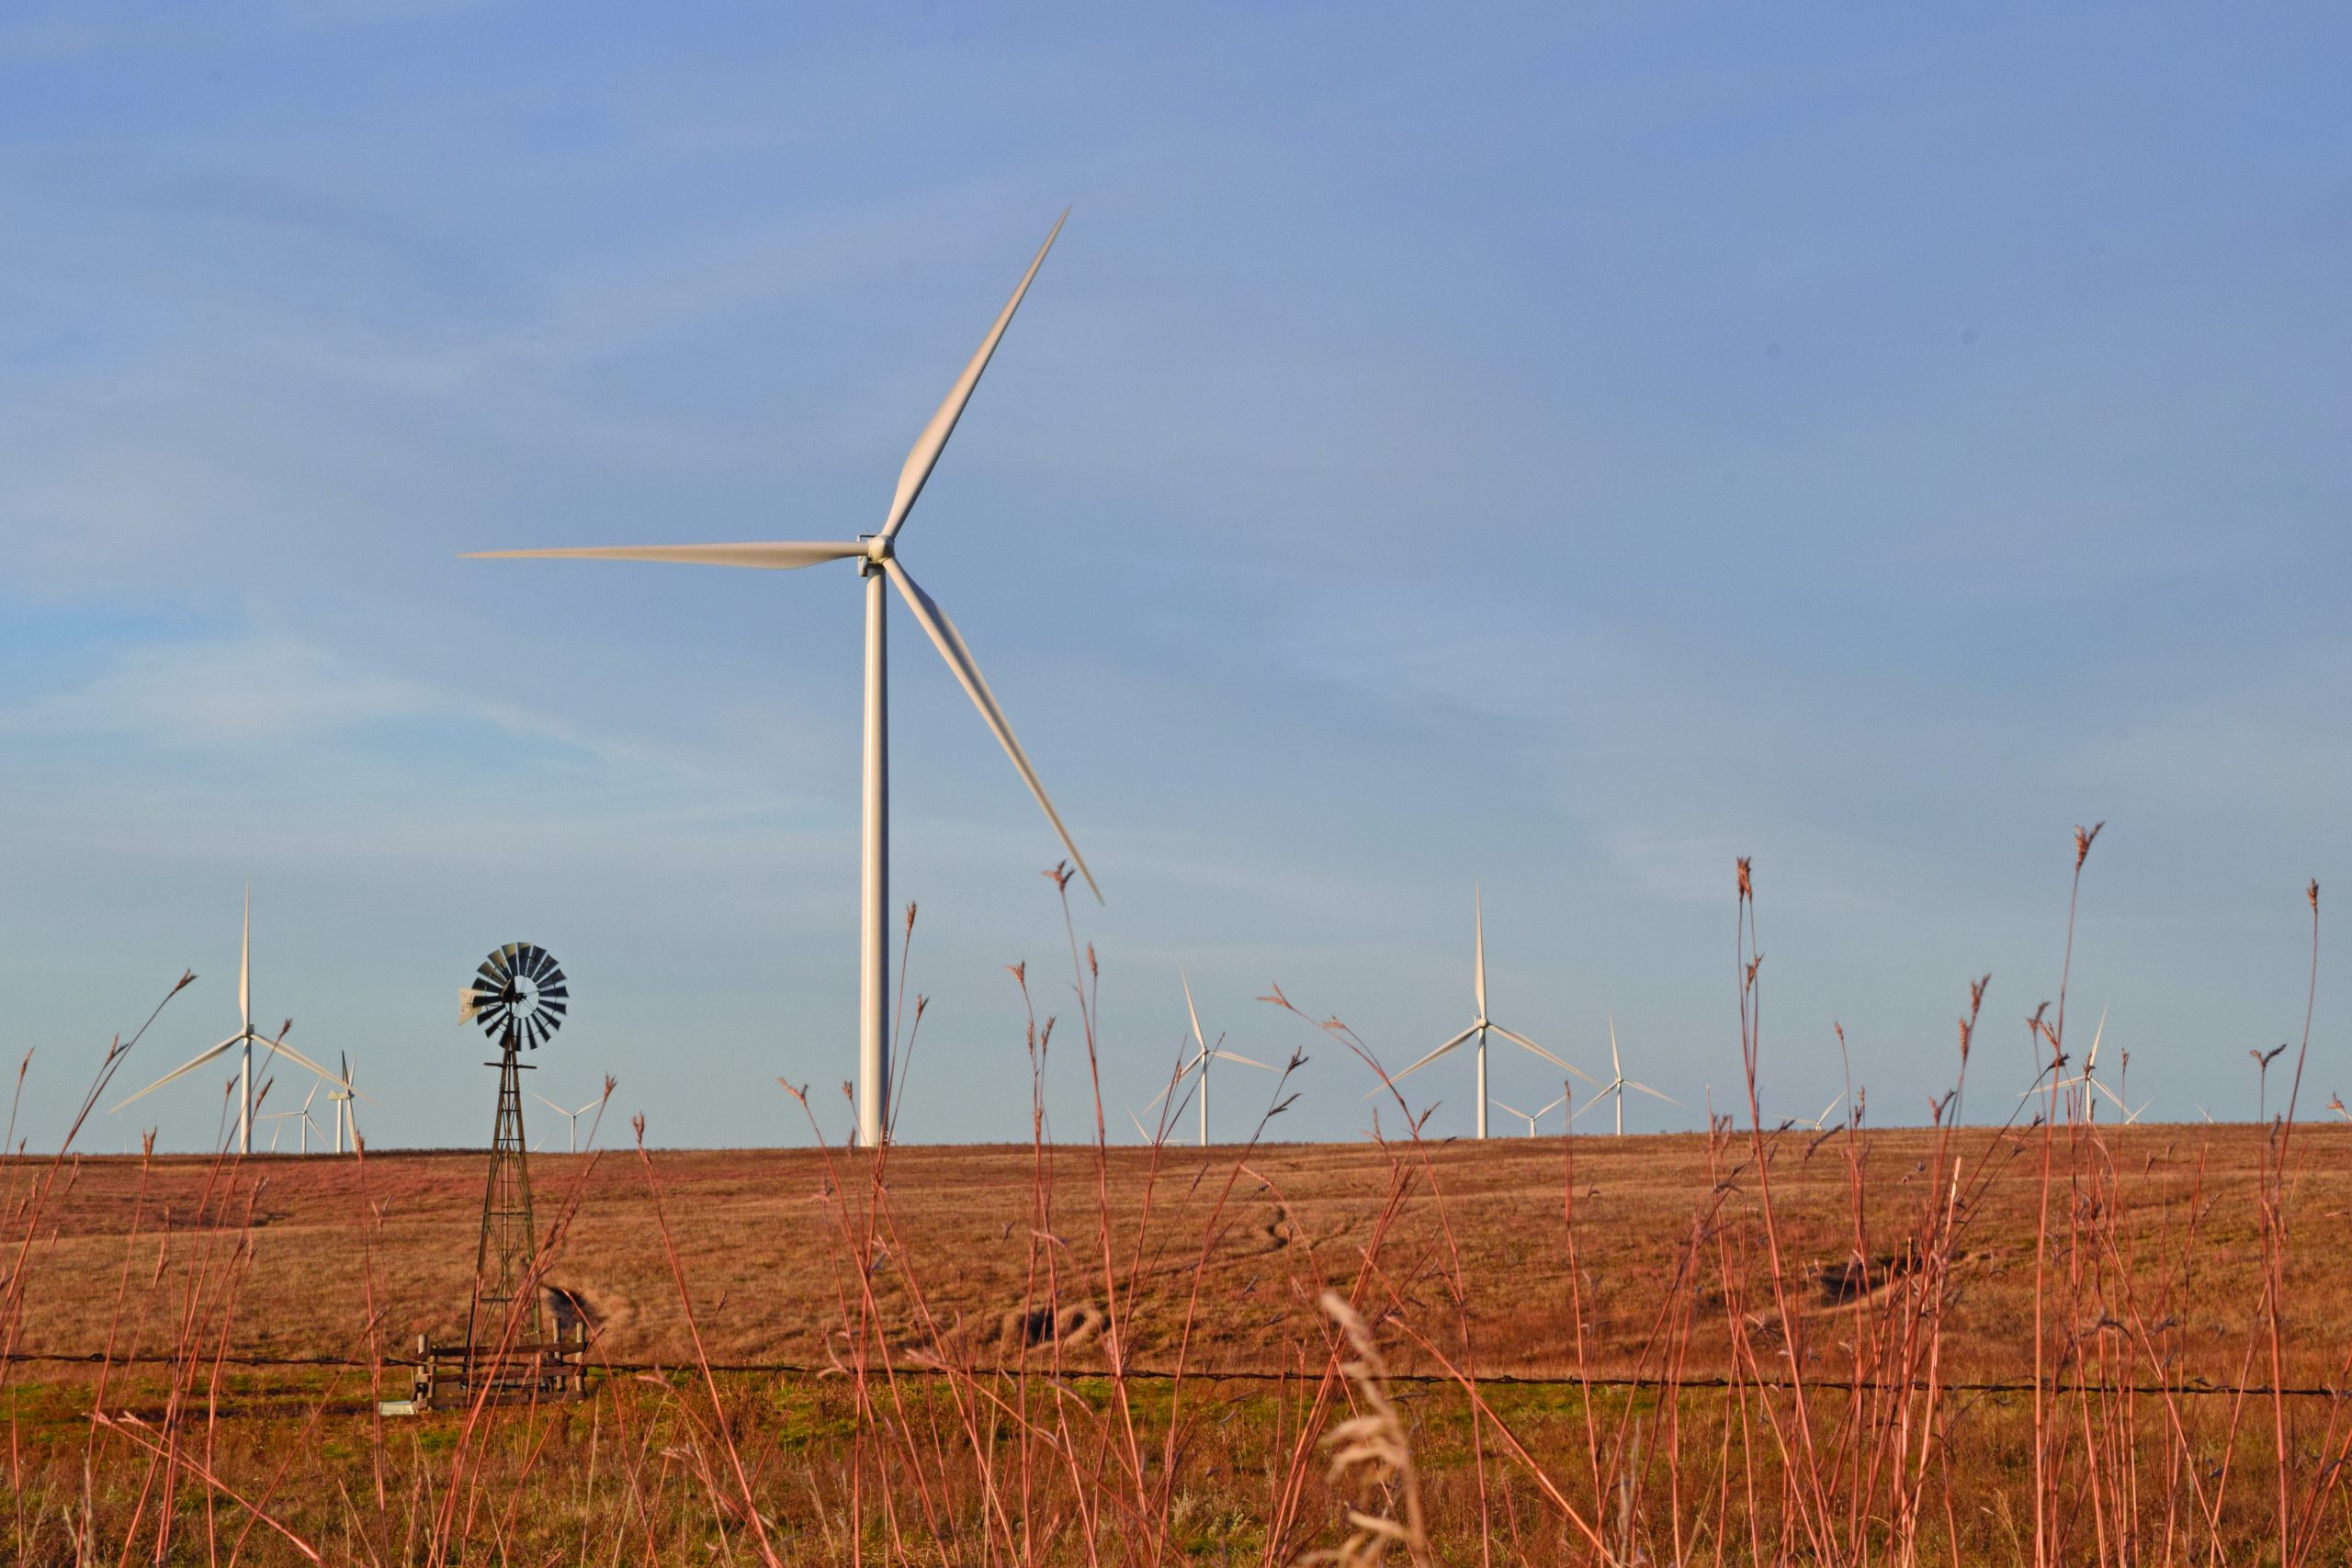
GE Renewable Energy (GE) led 2020 wind-power capacity installations, capturing 53 percent of new turbine capacity. Vestas ranked second with 35 percent of installations, followed by Siemens Gamesa Renewable Energy (SGRE) with 10 percent. Nordex USA represented the remaining 3 percent. On a capacity basis, the majority (71 percent) of turbines installed last year are rated between 2 MW to less than 3 MW, while 28 percent are rated at more than 3 MW. There are now 13 projects using 4-plus MW class turbines totaling 2,229 MW operating in the U.S.
GE’s 2.82-127 model was the most popular turbine installed in 2020, accounting for 28 percent of capacity additions, followed by Vestas’ V120-2.2 and the GE 2.5-127. For land-based wind projects, GE and Vestas account for 82 percent of projects under construction and in advanced development that have reported an OEM. GE represents 49 percent of this market; Vestas represents 33 percent, and Nordex captures 13 percent.
Capacity rating of wind turbines continues to steadily creep up, with the average turbine nameplate rating at 2.55 MW. Hub heights have reached an average of 90 meters, and rotor diameters averaged 121 meters in 2020. Increases in rotor diameter in most cases offer more efficiency gains than increasing hub heights.
These advances in wind-turbine capacity and scale are the primary drivers behind cost reductions. Median unsubsidized levelized cost of energy (LCOE) for land-based wind fell to $40/MWh in 2020, and this is a steady march in downward cost with LCOE having decreased 70 percent since 2009. Wind is now the lowest cost source of new power generations in many parts of the country.
Offshore Finally Taking Off
Offshore wind is finally poised to take off after many years of limited progress. The nation’s first commercial offshore wind project, the 30-MW Block Island Wind Farm, came online in December 2016, and no additional capacity was built until 2020 when the two-turbine, 12-MW Coastal Virginia Offshore Wind pilot project finished construction in June 2020. The bigger story is there are more than a dozen much larger projects on the cusp of moving forward. States are driving strong demand for offshore wind energy and have established targets to procure a total of more than 30,000 MW of offshore wind by 2035 in the 15 lease areas issued to date; 12 projects totaling 9,070 MW have secured a buyer, primarily through state solicitations, and most of this capacity will be brought online by 2026.
Additional solicitations are planned for the coming years in unleased areas of New York, North Carolina, South Carolina, California, Maine, and Hawaii to help states meet their offshore wind- and renewable-energy goals.
With stable policies in place, the Department of Energy found the U.S. could develop a total of 86 GW of offshore wind projects by 2050. As the U.S. continues to develop this homegrown resource, costs will continue falling, and value to consumers will grow. Just as LCOE has plummeted for land-based wind, costs have been rapidly dropping in the offshore sector as well — largely driven by enormous upscaling of wind-turbine size, which reduces the total number of foundations. Financial advisory firm Lazard is among the firms that estimates LCOE, and it finds that average LCOE for offshore wind was $87/MWh in 2020, down from its peak of $162/MWh in 2014. Further cost decreases are expected as technology improvements allow for larger turbines farther away from the shore.
The next generation 12-15 MW offshore turbines in varying stages of pre-commercial development stretches the imagination of what is physically possible in this sector. Two announcements of new offshore wind turbines have occurred recently: In May of 2020, Siemens Gamesa unveiled its 222-meter rotor 14-15 MW unit under advanced development. In February of this year, Vestas unveiled its V236-15.0MW unit; its model name denoting its 236-meter rotor diameter and 15 MW nameplate capacity. GE was an early contender in this technological arms race when it announced in 2019 its 12-14 MW Haliade-X unit was in advanced development — a leap from GE’s previous largest 6 MW unit. All these next generation turbines in the 12-15 MW range are critical to bringing down the cost of offshore wind by reducing the total number of turbines and capital-intensive foundations needed for an offshore wind plant.
In late March 2021, the Biden-Harris administration announced an ambitious but achievable offshore wind goal of 30 GW by 2030. As the value of offshore wind is realized by consumers, utilities, and other stakeholders, the U.S. will see new jobs and investments in manufacturing and port infrastructure to support the growing offshore sector. A recent analysis by ACP found developing 30 GW of offshore wind could support up to 83,000 jobs and deliver $25 billion annually in economic output by 2030.


